The project

MamoRef: optical mammography for breast lesion characterization

A non-invasive system, developed by the Biomedical Optics Group at CIFICEN (CONICET–UNICEN) under the BIONiRS brand, that generates breast metabolic activity maps to help distinguish benign from malignant lesions.

The science

Whole-field continuous-wave diffuse reflectance

MamoRef is a diffuse optical imaging system: it illuminates the breast with near-infrared laser light and reconstructs metabolic-activity maps from how that light scatters and is absorbed in tissue. This section follows the technical detail published in the group's two papers — Carbone et al., Phys. Med. Biol. 2024 and Carbone et al., Technology in Cancer Research & Treatment 2026 — so that everything shown here can be traced back to the source.

Why infrared light instead of X-rays?

X-rays and near-infrared light give a diagnosis two different, and largely complementary, kinds of information:

X-rays (mammography)NIR light (MamoRef)
RadiationIonizingNon-ionizing
What it showsStructural information — tissue densityMetabolic information — oxygenation and vascularization
Spatial resolutionHighLower
Equipment complexity / costMedium to highLow

That's why MamoRef is meant as a complement to mammography, not a replacement: it adds a different kind of information, with simpler, more accessible equipment.

The near-infrared optical window

Biological tissue is what physics calls a turbid medium: unlike X-rays, NIR light isn't just absorbed as it passes through — it also scatters many times before exiting. Between 600 and 900 nm, the optical window, hemoglobin absorbs relatively little below that range and water absorbs heavily above it, making this the band where light can penetrate several centimeters of tissue and still be detected.

More formally, a turbid medium is described by two coefficients: the absorption coefficient (μa, how much a photon is lost to absorption per centimeter traveled) and the scattering coefficient (μs, how often it bounces off before changing direction). In healthy breast tissue, at 750 nm, typical values are μa ≈ 0.05 cm⁻¹ and a reduced scattering coefficient μs′ ≈ 8.7 cm⁻¹: scattering dominates heavily over absorption, almost 200 to 1, which is exactly what makes a medium turbid and lets light travel several centimeters of tissue before exiting, instead of being absorbed right away (Carbone, PhD thesis, UNICEN, 2017).

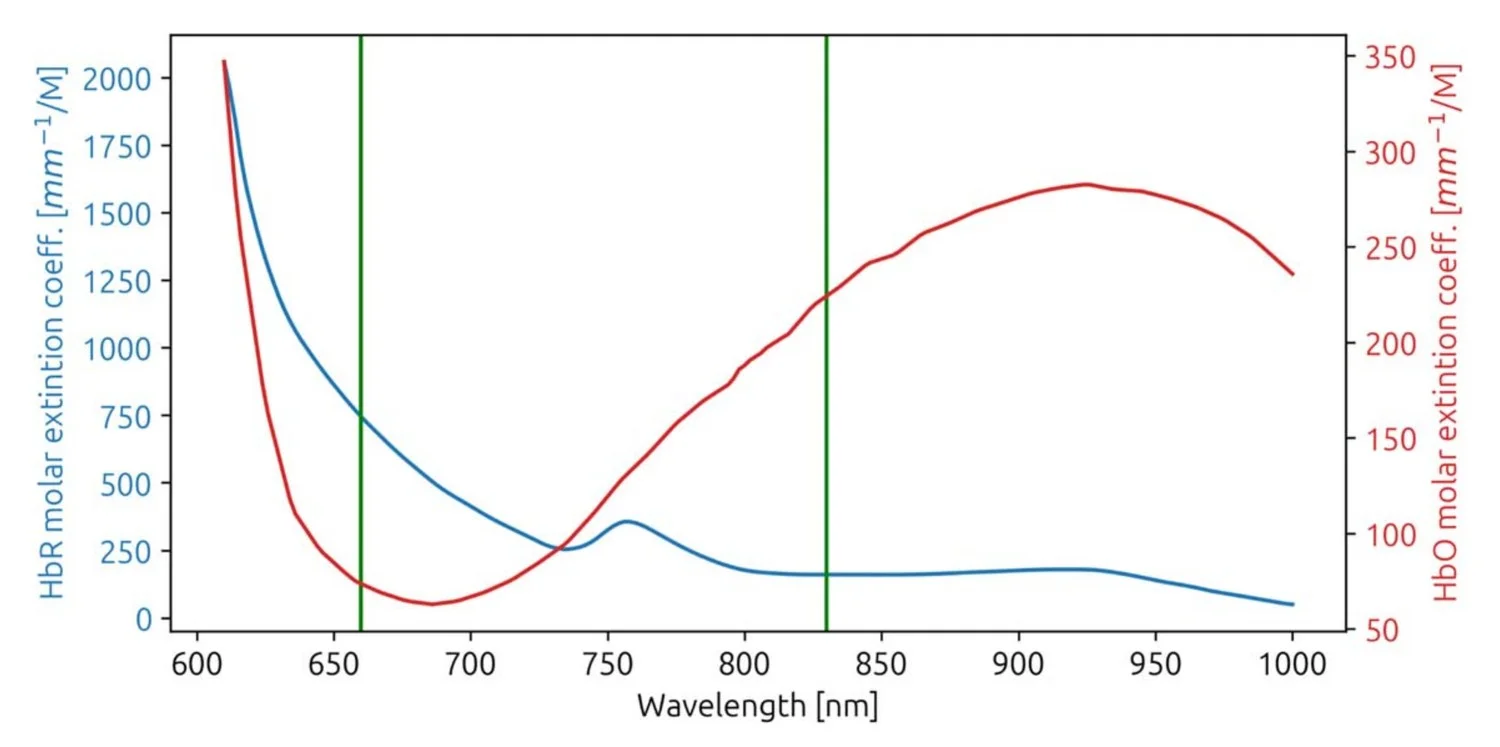
Within that window, the molar extinction coefficients of oxygenated (HbO) and deoxygenated (HbR) hemoglobin differ strongly from each other and change with wavelength, crossing at the so-called isosbestic point, near 800 nm. Choosing wavelengths on each side of that point makes it mathematically possible to separate how much light each form of hemoglobin absorbs.

Molar extinction coefficient spectra for HbR and HbO, with green lines marking MamoRef's laser wavelengths

Molar extinction coefficients for HbR (blue) and HbO (red). Green lines mark 660 and 830 nm, MamoRef's lasers on each side of the isosbestic point. Figure 1, Carbone et al. 2024 (Phys. Med. Biol.).

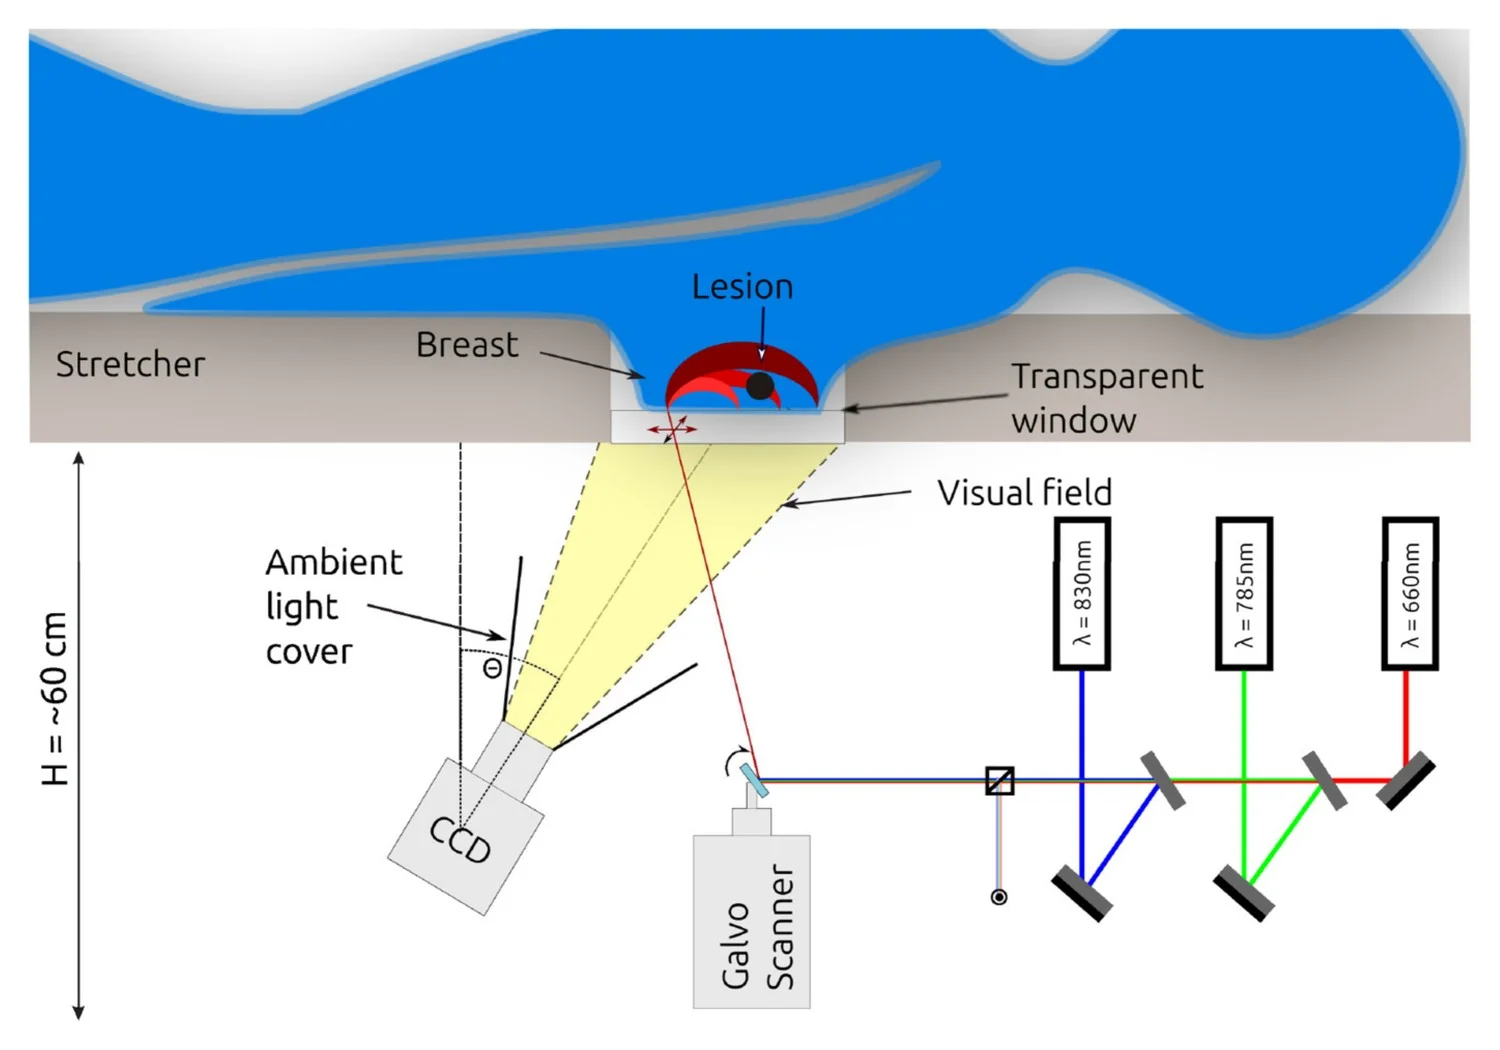
Schematic of the MamoRef device: three lasers combined into one beam, directed by a galvo-scanner toward the breast resting on a transparent window, with a CCD camera tilted 30° capturing the diffuse reflectance

MamoRef schematic. Figure 2, Carbone et al. 2026 (Technology in Cancer Research & Treatment).

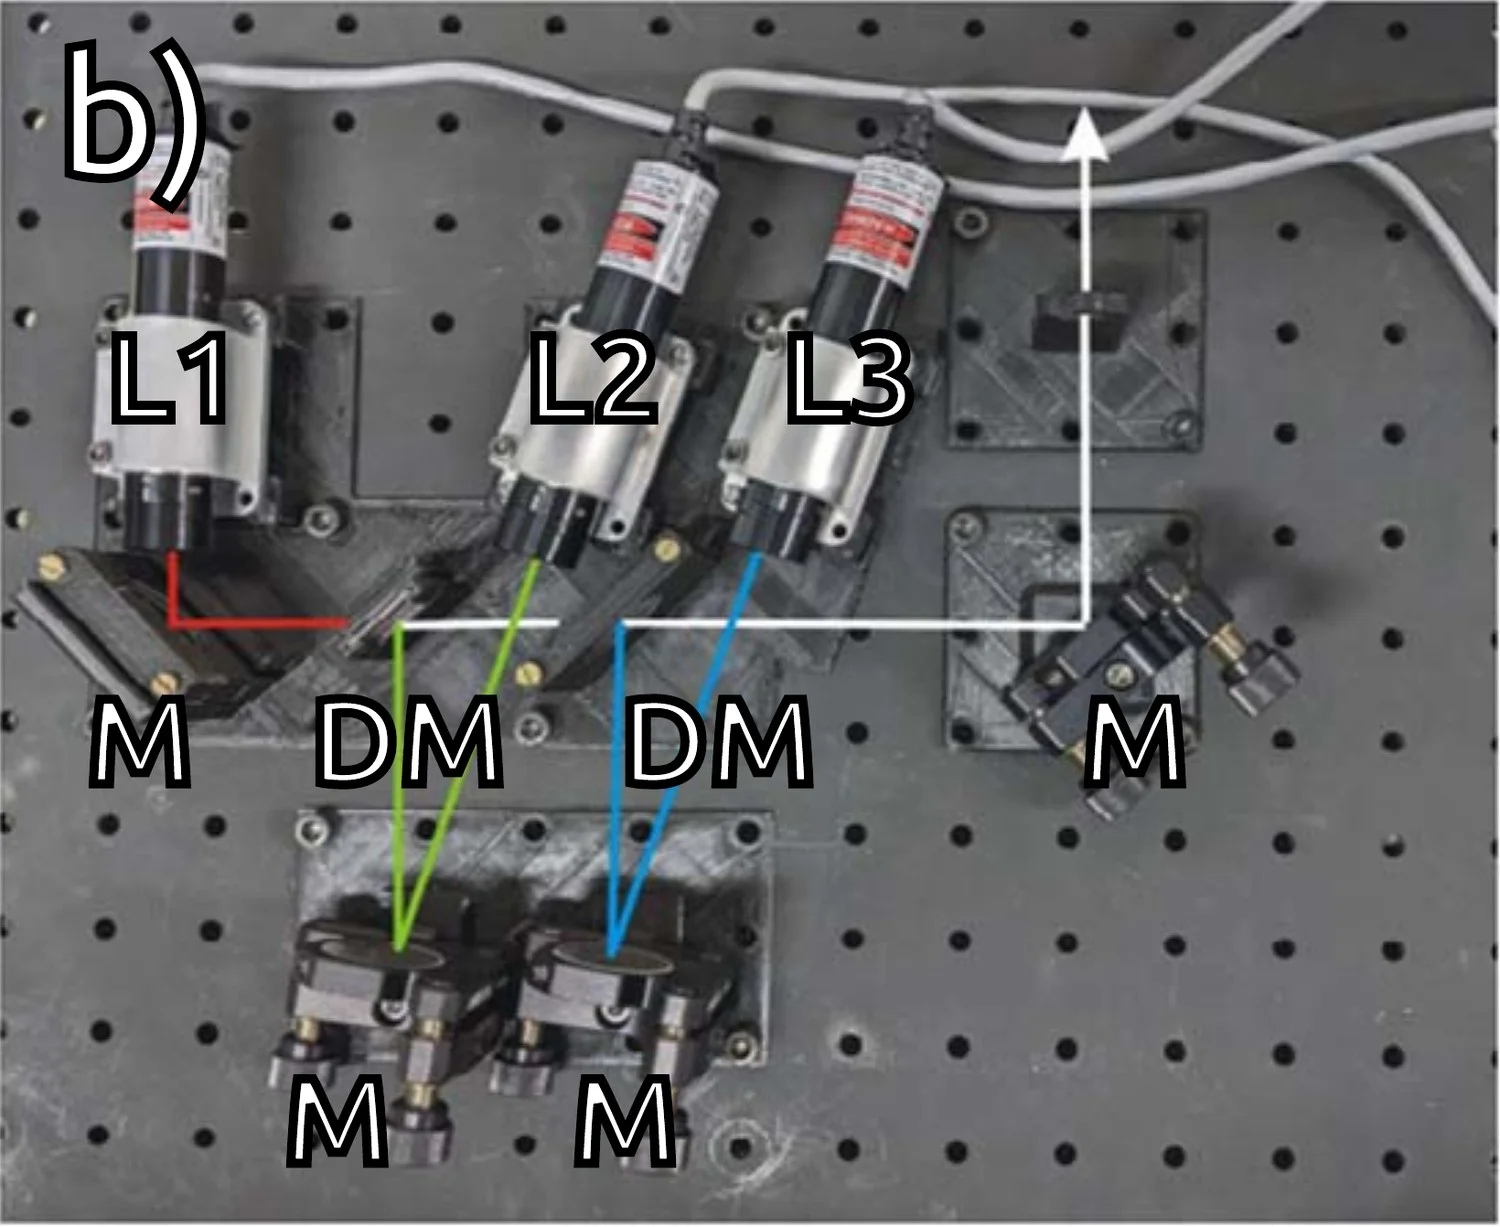
Real photograph of MamoRef's three-laser assembly with the dichroic mirrors that combine the beams

The real assembly of the three lasers and the dichroic mirrors that combine their beams into one. Figure 3, Carbone et al. 2024.

The device

The patient lies face-down (prone) on a stretcher with a transparent acrylic (PMMA) window; she rests one breast at a time on the window, flattened only by her own body weight — no additional mechanical compression.

Below the window, inside a light-tight enclosure, sit the optical components:

ComponentSpecification
Lasers3 continuous-wave diode lasers, 660 nm / 785 nm / 830 nm (Coherent Stingray series), combined into a single beam via dichroic mirrors; power capped at ≤5 mW for safety
Scanning2-axis galvanometer (ThorLabs GVS012/M) steering the combined beam over a ~6×6 to 10×10 position grid (mean of 68 positions across 42 clinical measurements)
DetectionHigh-sensitivity CCD camera (ThorLabs Kiralux CS505MU) with a 12 mm f/1.4 lens, tilted 30° off the window's axis to avoid capturing the laser's specular reflection
Scan time~2 s of capture per position → 6 to 10 minutes per breast
ControlCustom electronics (STM32F103 microcontroller, 16-bit DAC) and a Python/tkinter GUI for selecting the region of interest and operating the device

Hardware specifications per Carbone et al. 2024 (Phys. Med. Biol.), sections 2.1–2.3.

From raw data to metabolic map

For each grid position and wavelength, the camera captures a reflectance image. The processing, detailed in both papers, follows these steps:

  1. Each image is cleaned by subtracting a background image (ambient and sensor noise), and the area around the illuminated point is cropped.
  2. The set of crops is averaged to build a reference image, and each crop is normalized against it — this evens out exposure across the scan and enhances any tissue inhomogeneity.
  3. The normalized crops are reassembled into a single relative attenuation image, A(λ,r), for each wavelength.
  4. That attenuation is related to the relative change in the tissue's absorption coefficient, Δμa(λ), through the modified Beer-Lambert law.
  5. Since absorption is a linear combination of HbO and HbR (each with its own molar extinction coefficient), using at least two wavelengths sets up a linear system solved pixel by pixel, yielding ΔHbO and ΔHbR.
  6. Relative oxygen saturation is derived as ΔSatO₂ = HbO / (HbO + HbR).
An important caveat: because the laser is continuous-wave (not pulsed or time-resolved), MamoRef cannot measure absolute hemoglobin concentrations — only differences relative to the average of the entire scanned area. That's why every map is expressed as ΔHbX(x,y) = HbX(x,y) − median(HbX). This same choice also reduces the influence of other, less wavelength-dependent chromophores, such as melanin.

Validating the algorithm: simulations and phantoms

Before testing it on patients, the reconstruction algorithm was validated with Monte Carlo simulations (using the GPU-accelerated MCX simulator) on 10 mm spherical inclusions emulating a benign fibroadenoma and an invasive carcinoma: the structural similarity (SSIM) between the reconstruction and the known ground truth was above 0.8 in all cases, and two inclusions separated by 20 mm or more were correctly resolved (at 15 mm, they were not). It was also confirmed that a chest wall at 2 cm depth does not distort the recovered relative concentrations.

The exercise was then repeated with physical phantoms (milk diluted with agarose and two inks of different absorbance standing in for HbO/HbR), measured with the real device: the algorithm correctly recovered the relative proportions between the two dyes, confirming that hardware and software work consistently end to end.

Clinical validation

What the two published studies show

MamoRef has, to date, two peer-reviewed clinical studies, both at Hospital Privado de la Comunidad (HPC), Mar del Plata — a high-complexity hospital with a mastology unit accredited since 2018. These are two distinct studies with distinct goals: we keep them separate here, as published, rather than blending their numbers.

Usability and patient comfort

Between designing the device and validating it clinically, there's a less visible piece of work that matters just as much: making sure that lying down on the stretcher and going through the study is a comfortable, clear experience. MamoRef went through two prototype generations, and each one was evaluated on that front too, not only on diagnostic accuracy.

Prototype V1 (2020–2023) — TRL 5.5

  • 2 prototypes built and tested.
  • Clinically validated at Hospital Privado de la Comunidad (HPC).
  • The usability evaluation identified comfort and ergonomics issues, which shaped the redesign of the next prototype.

Prototype V2 (2023–2025) — TRL 6

  • 3 prototypes built and tested, with a more ergonomic design.
  • Clinically validated at Hospital Británico and INTECNUS.
  • The usability test showed very good results and high acceptance among patients.
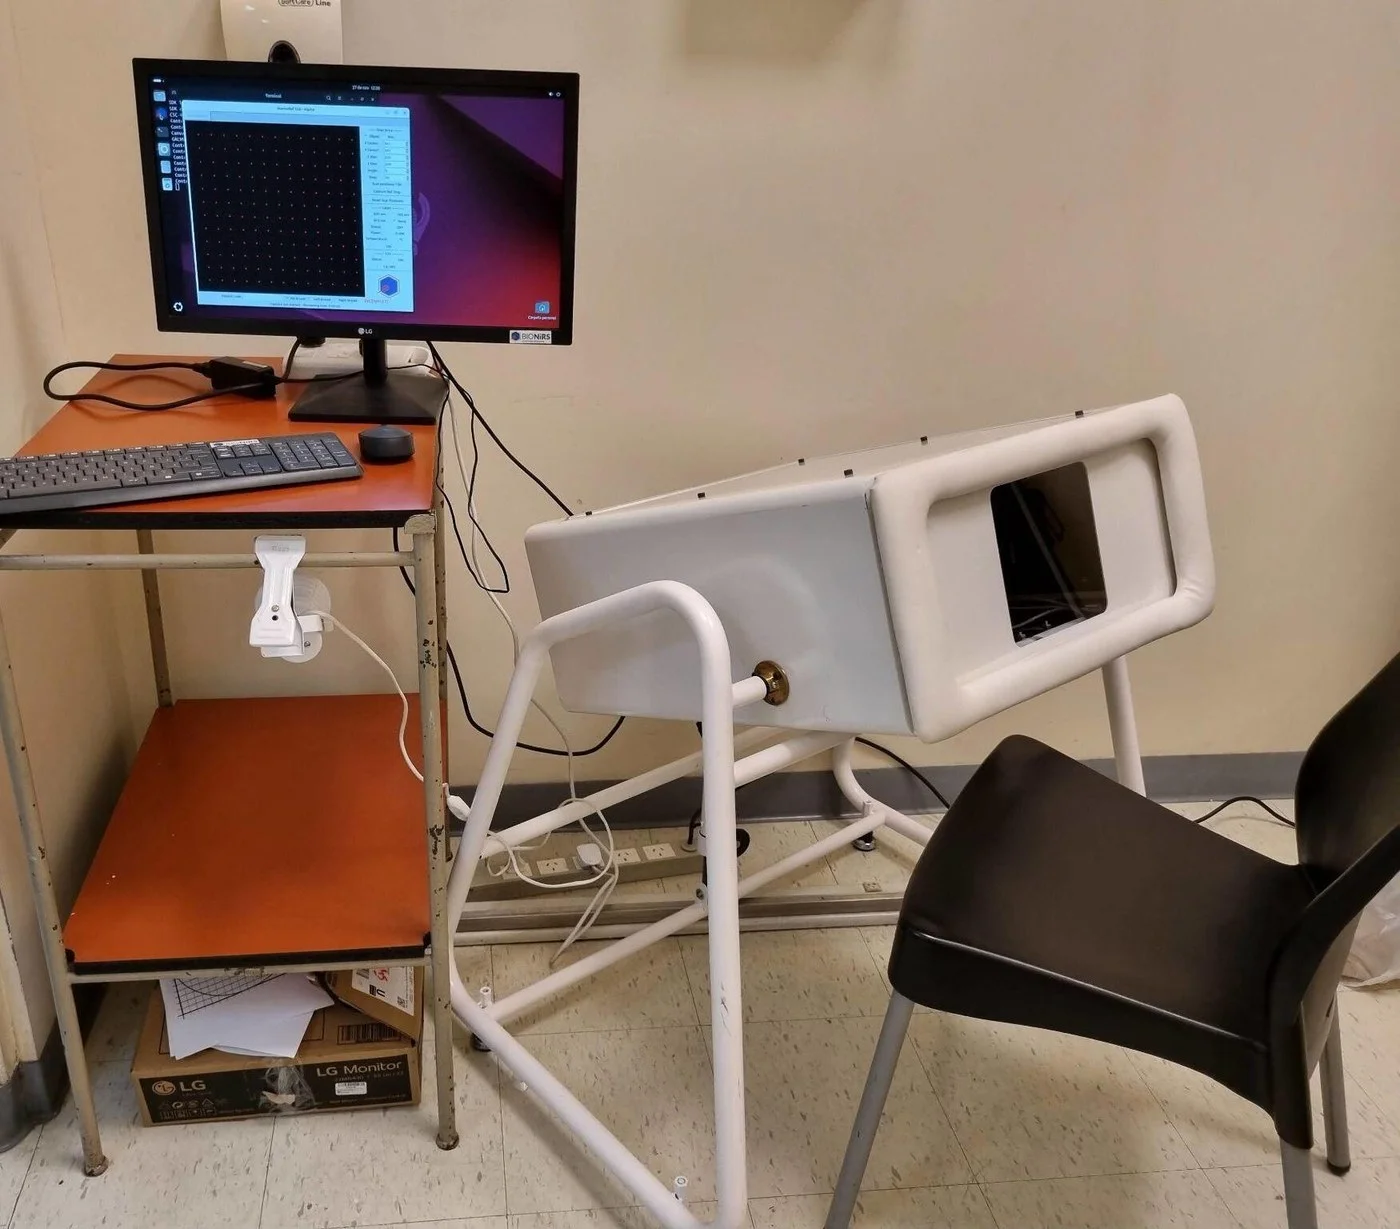
MamoRef's V2 prototype installed in a hospital exam room, next to the computer running the control software and the patient's chair

The V2 prototype installed at one of the hospitals where it was clinically validated, with the control software that defines the measurement grid.

Feasibility study (Carbone et al. 2024, Phys. Med. Biol.)

The first paper describes the device's design and an initial clinical feasibility study: at the time of writing, 42 measurements had been made on volunteers. The paper presents two representative cases in detail:

Case 1 · Invasive ductal carcinoma

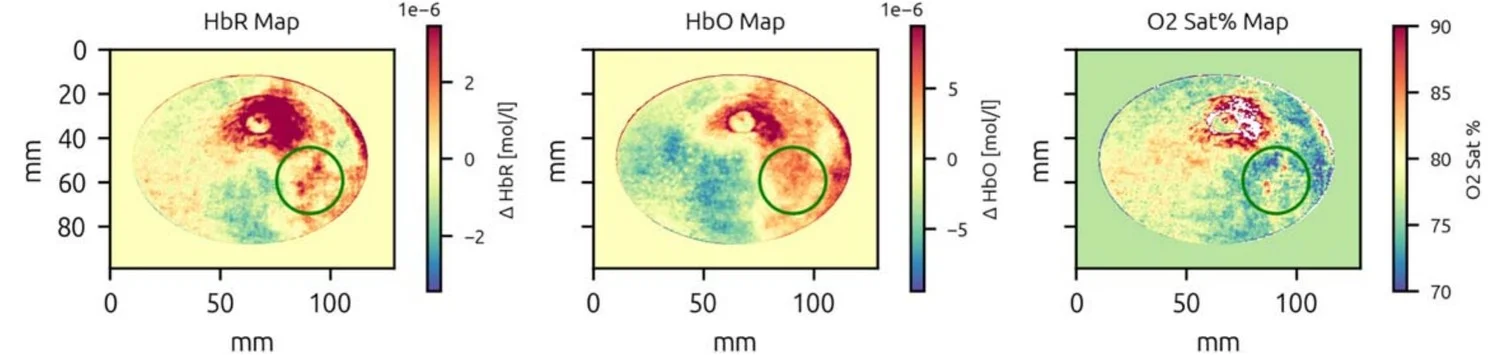
  • Mammography: oval, hyperdense 24×28 mm lesion with microcalcifications, upper outer quadrant of the left breast (hour 1). BI-RADS IV.
  • Biopsy: invasive ductal carcinoma (NST), Nottingham grade II.
  • MamoRef: periareolar region of higher metabolism/absorption, irregular margins, 32×25 mm — consistent with the mammography and ultrasound findings.

Case 2 · Fibroadenoma

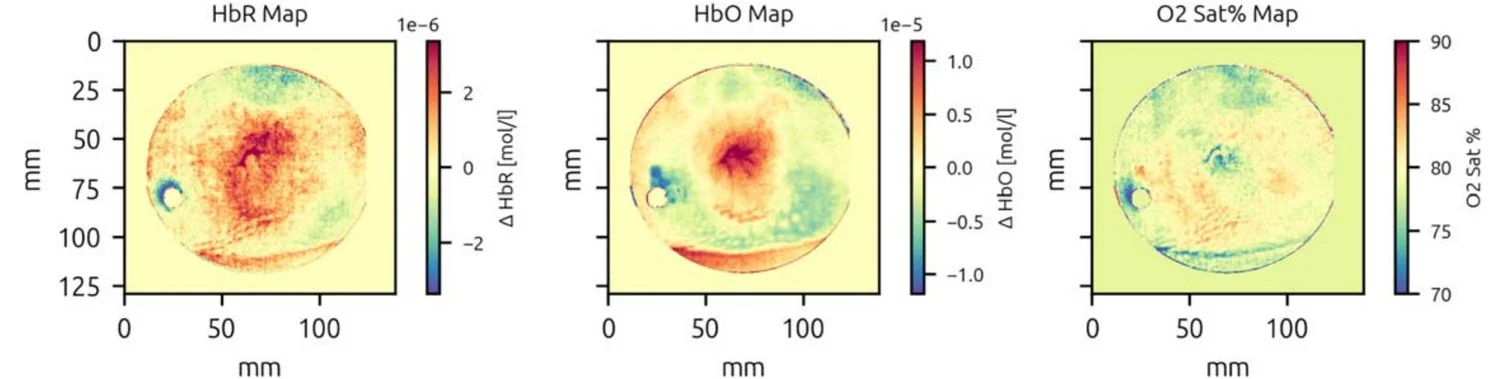
  • Ultrasound: ovoid hypoechoic image, 23.3 mm, well-defined margins, no apparent vascularization, hour 7. BI-RADS III.
  • Biopsy: fibroadenoma, no atypia.
  • MamoRef: no focal areas of increased metabolism (only the expected nipple pigmentation) — consistent with a low-vascularity lesion.
HbR, HbO and oxygen saturation maps for Case 1 (invasive ductal carcinoma), with the lesion marked by a green circle

Case 1: the green circle marks the region of higher uptake. Figure 13, Carbone et al. 2024.

HbR, HbO and oxygen saturation maps for Case 2 (fibroadenoma), with no focal region standing out

Case 2: no focal region stands out, consistent with a benign lesion. Figure 14, Carbone et al. 2024.

Prospective study (Carbone et al. 2026, Technology in Cancer Research & Treatment)

The second paper is a more formal prospective study, carried out between April and November 2023 at HPC, approved by its ethics board (CIREI) and authorized by the Buenos Aires Province Ministry of Health. 21 patients were included, all of whom already required a core biopsy due to suspicious findings on mammography, ultrasound, or MRI (one was excluded from the final analysis because her lesion could not be adequately biopsied). Of all biopsies performed, 7 were cancer (2 of them in situ); the rest were benign lesions (fibroadenomas, fibrosis, periductal mastitis, among others).

Of the MamoRef studies performed, 4 were discarded for artifacts (incomplete breast support on the window, reflections from scratches on the acrylic, patient movement), leaving 17 evaluable sets of maps. Five NIRS-specialized professionals, blinded to each case's diagnosis, scored each image set on a 6-point scale (0 to 5) modeled after BI-RADS, from "normal tissue" to "highly suggestive of malignancy."

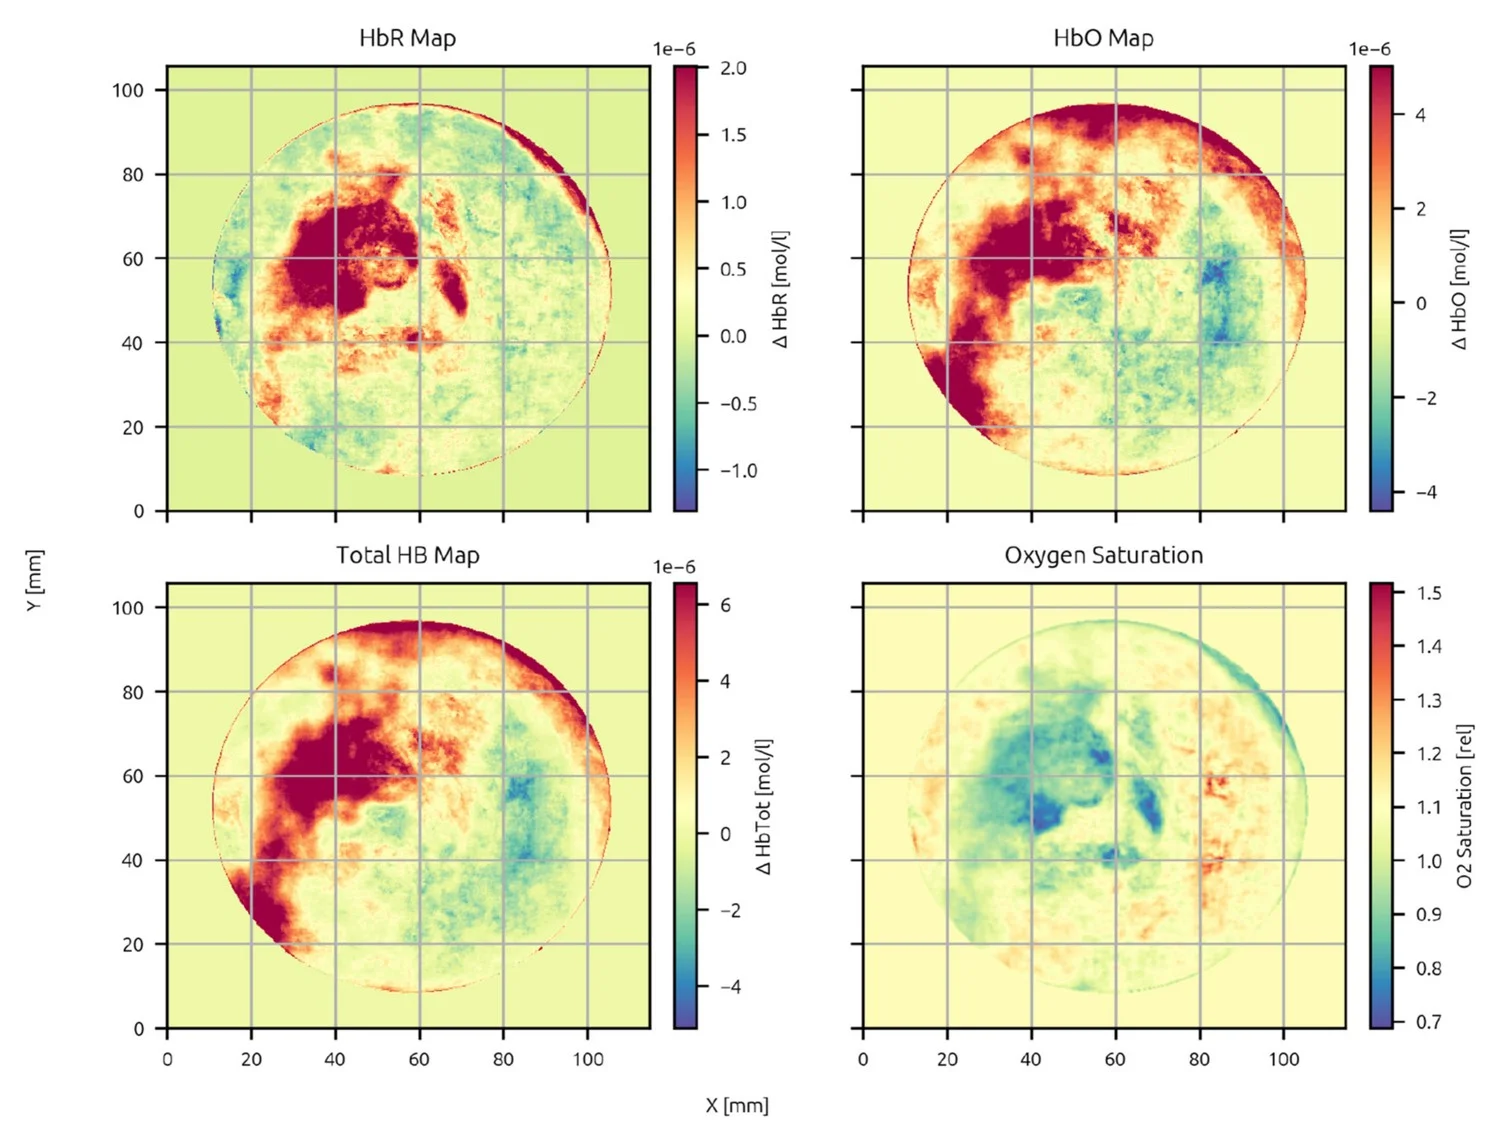
HbR, HbO, total hemoglobin and oxygen saturation maps for patient 8, with biopsy-confirmed invasive ductal carcinoma

Patient 8: invasive ductal carcinoma (NOS), Luminal B subtype. The region of highest ΔHbR sits at x=20–40 mm, y=40–50 mm (hour 7–9), with an extensive region of higher ΔHbO/total hemoglobin around it —consistent with neovascularization around necrotic tissue— and lower SatO₂ in that same area. Figure 3, Carbone et al. 2026.

Statistical results

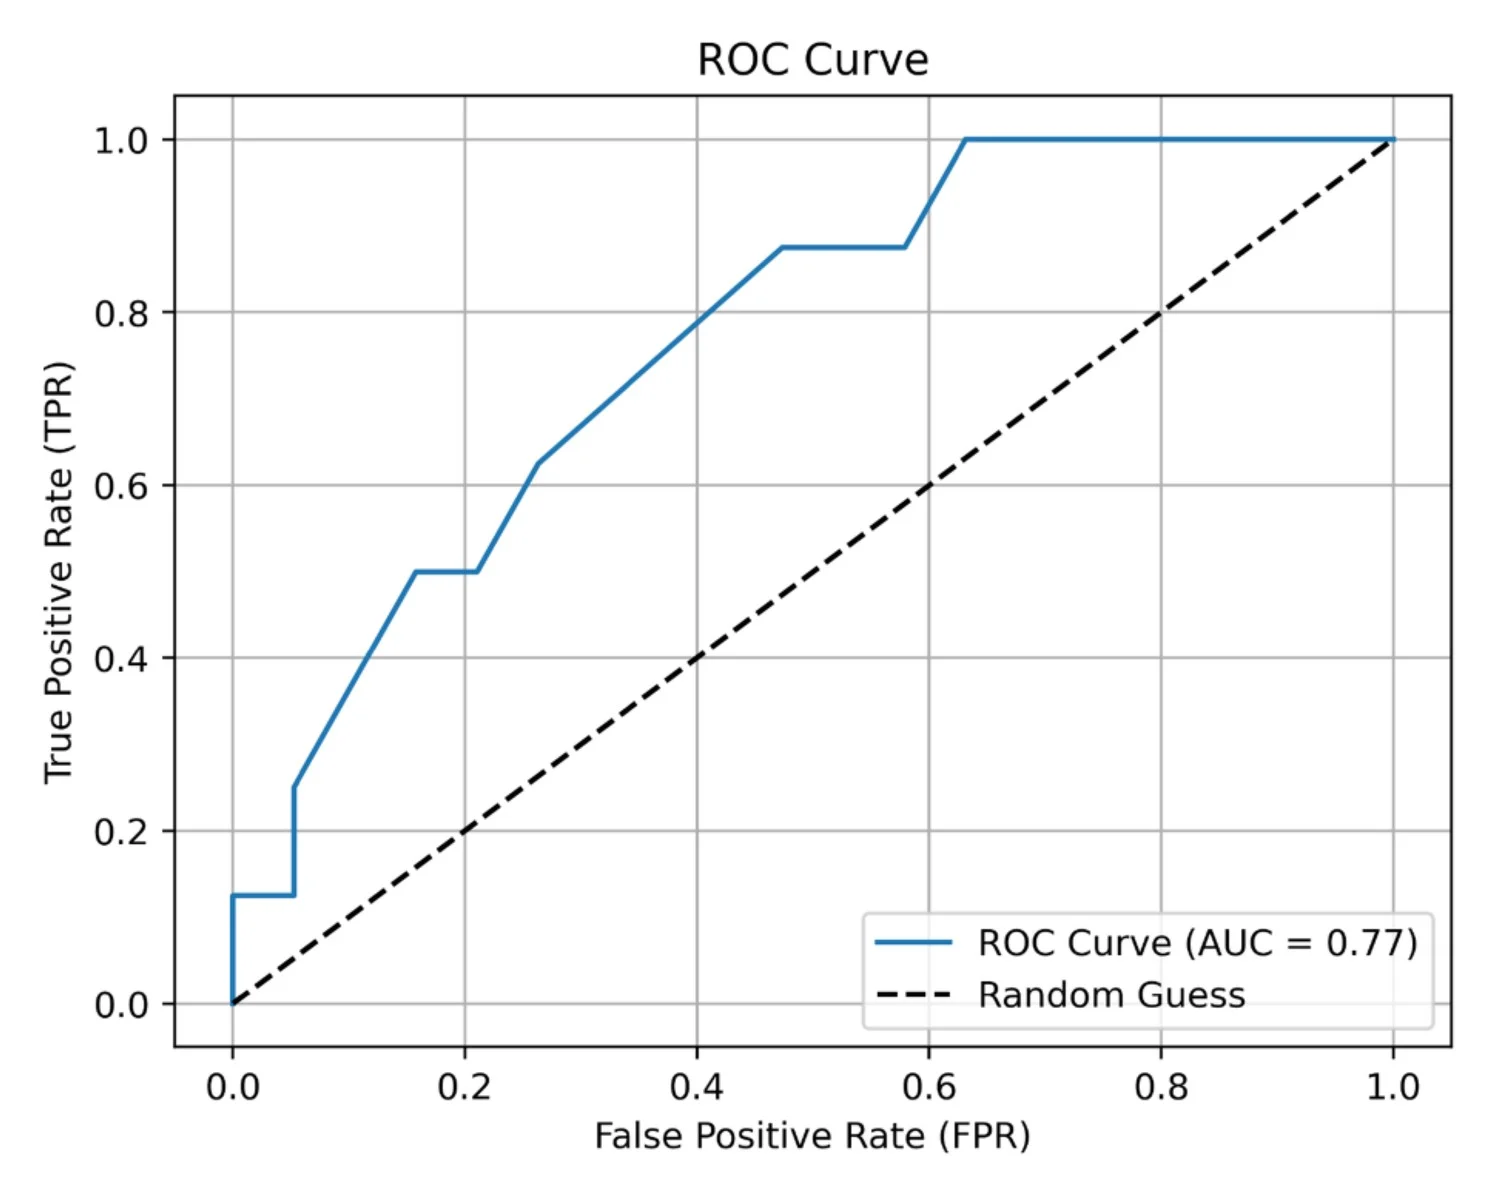
At the threshold that maximizes Youden's J statistic on the ROC curve (0.6):

  • AUC = 0.77
  • Accuracy: 70% (90% CI: 55%–85%)
  • Sensitivity: 62% (90% CI: 33%–87%)
  • Specificity: 74% (90% CI: 56%–90%)

Comparing MamoRef's maps against pathology (biopsies) showed close to 80% agreement. Agreement among the 5 evaluators (Fleiss' kappa) was 0.253 — "slight" to "fair": expected for a first clinical experience, with evaluators who had no prior training interpreting this new kind of image.

MamoRef ROC curve, AUC = 0.77

ROC curve from the prospective study (AUC = 0.77). Figure 7, Carbone et al. 2026.

How it compares to standard techniques

TechniqueAccuracySensitivitySpecificityAUC
MamoRef70%62%74%0.77
Mammography71.8%34%–60%*80%–91%*0.73
Ultrasound46.9%47%–100%*19%–100%*0.768
MRI—55%–92%*70%–88%*0.93

*Ranges from different studies cited in the literature (see Table 5, Carbone et al. 2026) — the spread across studies for the same technique is itself a sign of how hard it is to pin down definitive reference values. MamoRef's confidence intervals are wide given the still-small sample size.

What the authors say about the limitations: both papers are explicit that these are preliminary results, from first-generation prototypes, with small samples and evaluators with no prior experience interpreting these images. The authors themselves expect accuracy, sensitivity, and inter-rater agreement to improve with more cases, better-trained personnel, and the AI-assisted reconstruction algorithm they're developing (a U-Net-style convolutional neural network trained on Monte Carlo simulations, also aiming for depth resolution).

Where we stand

Current state of development

From lab prototype to hospital validation: here's how MamoRef has progressed.

Completed

  • Two clinical prototype versions — Technology Readiness Level 6
  • Feasibility study: 42 clinical measurements (Phys. Med. Biol., 2024)
  • Prospective study: 21 patients, 7 biopsy-confirmed cancers, AUC 0.77 (Technology in Cancer Research & Treatment, 2026)
  • US patent granted in 2024 to CONICET: US12165320B2
  • Second international (PCT) application, published in 2025 to Bionirs and UNCPBA: WO2025004047A1
  • Reconstruction code published on GitHub
Frequently asked questions

What people usually ask about MamoRef

What is MamoRef?

MamoRef is an optical mammography system developed by BIONiRS. It uses near-infrared (NIR) laser light instead of X-rays to generate breast tissue metabolic activity maps that help classify lesions as benign or malignant.

Who developed MamoRef?

The Biomedical Optics Group at CIFICEN (CONICET–UNICEN–CICPBA), in Tandil, Argentina, led by Dr. Juan Pomarico (director) and Dr. Nicolás A. Carbone (the project's lead researcher), under the BIONiRS brand.

Does MamoRef use ionizing radiation?

No. It uses low-power, non-ionizing near-infrared laser light, unlike X-ray mammography.

Does MamoRef replace traditional mammography?

No. It's designed as a complement: it adds metabolic information to standard imaging techniques, helping reduce unnecessary biopsies and improve lesion follow-up.

Is MamoRef already approved for clinical use?

It's at the clinical validation stage (TRL 6), with two peer-reviewed published studies (42 measurements in 2024; 21 patients and an AUC of 0.77 in 2026). Regulatory validation with ANMAT and FDA, and multicenter clinical studies, are the project's next steps.

How do I contact the MamoRef / BIONiRS team?

You can write directly to Nicolás Carbone at ncarbone@ifas.exa.unicen.edu.ar, or visit the contact page.

Open science

Everything shown here is published

Two peer-reviewed papers and a visual project summary, available to read and download.

Team & institutions

A multidisciplinary effort

MamoRef is made possible by a team of physicists, physicians, and health institutions working together, based at the Biomedical Optics Group at CIFICEN (CONICET–UNICEN), in Tandil.

Grupo de Óptica Biomédica (GOB — Biomedical Optics Group) CONICET and Universidad Nacional del Centro de la Provincia de Buenos Aires (UNICEN) IFAS — Instituto de Física Arroyo Seco
Hospital Privado de la Comunidad — Mar del Plata Hospital Británico INTECNUS